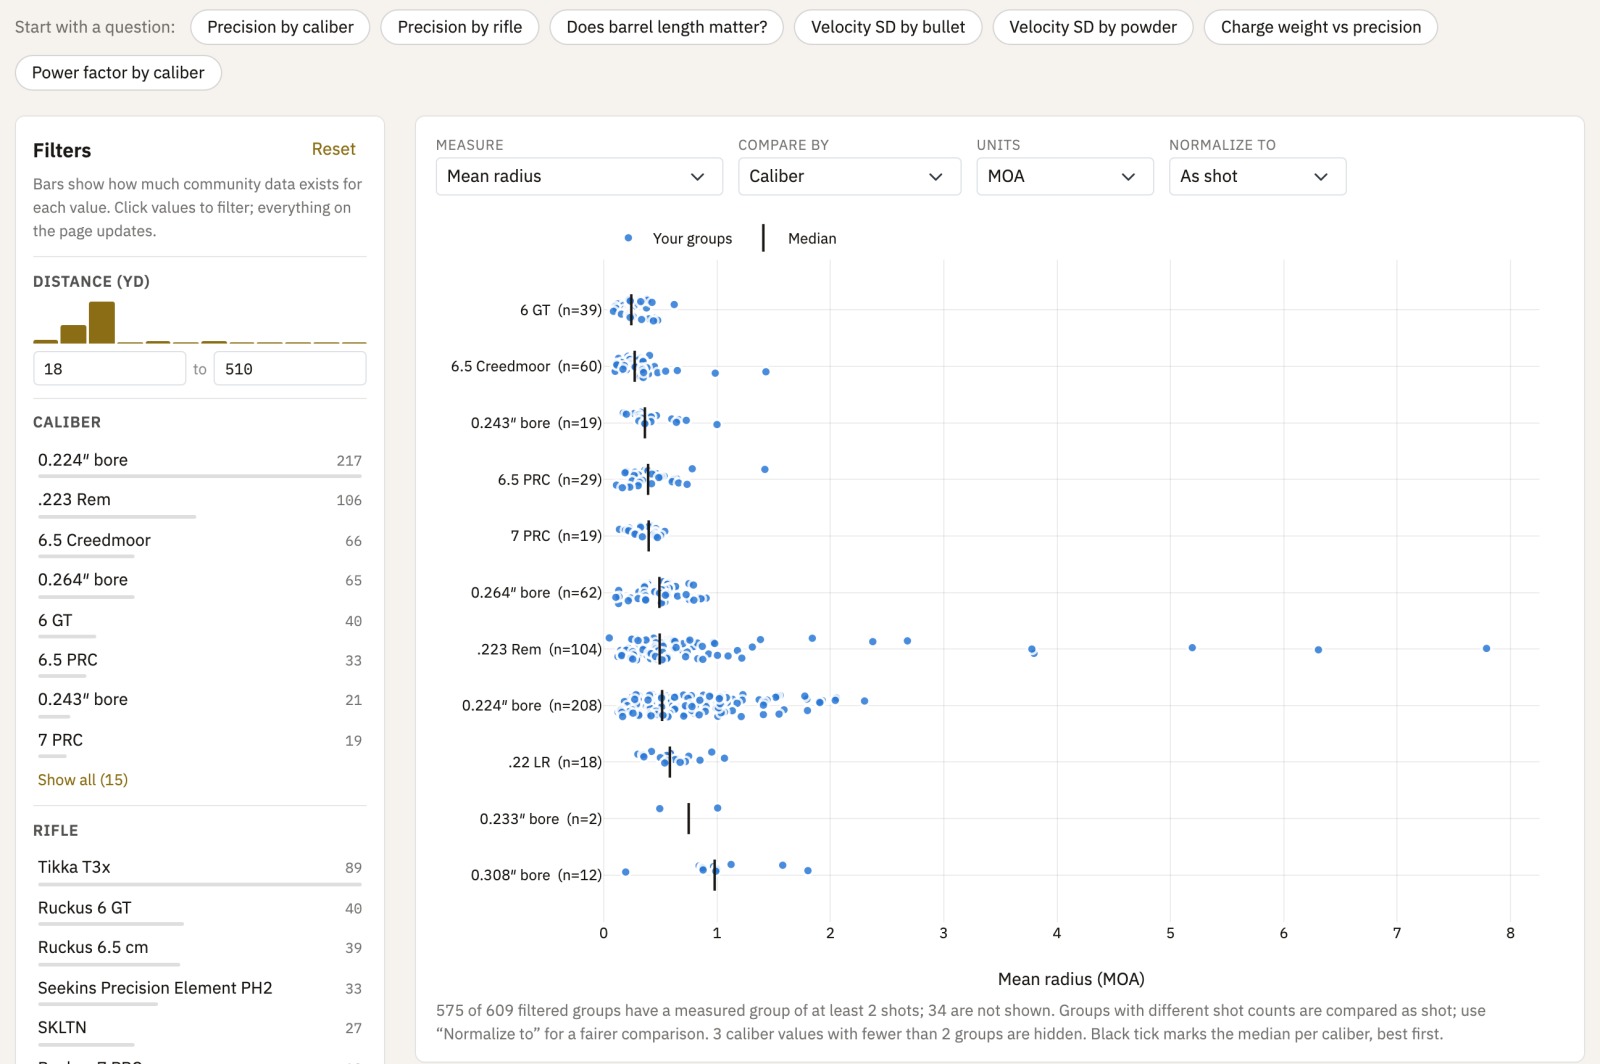
One session, start to finish
Here is what load development looks like on DimeShooters. Every image below is the actual product, showing a real powder-charge ladder from our own logbook.
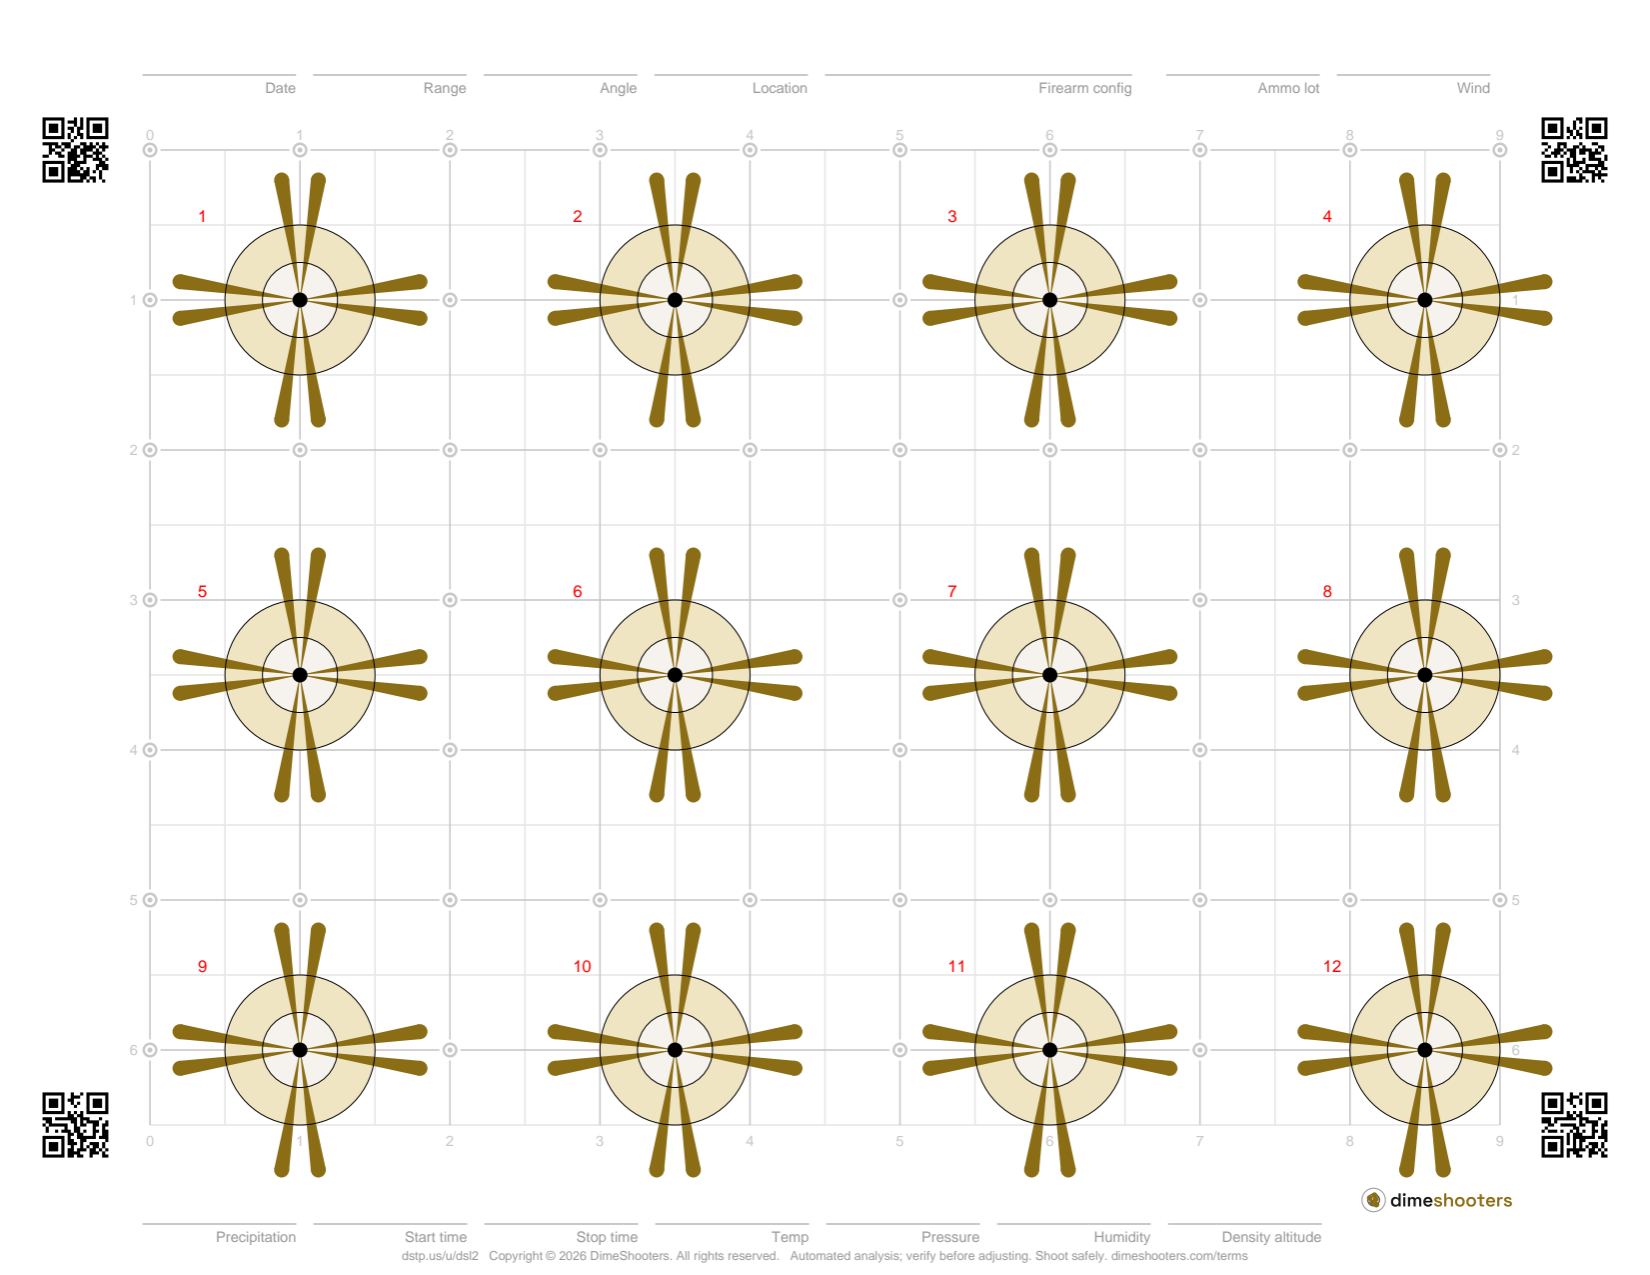
1Plan it before you load
Say you want to know which of five charges groups tightest. The Planner tells you how many shots at each one you need to reliably pick the right winner, before you spend the components and the barrel life.
Groups too small to answer the question are the most expensive mistake in load development. The Planner exists so you stop making it.
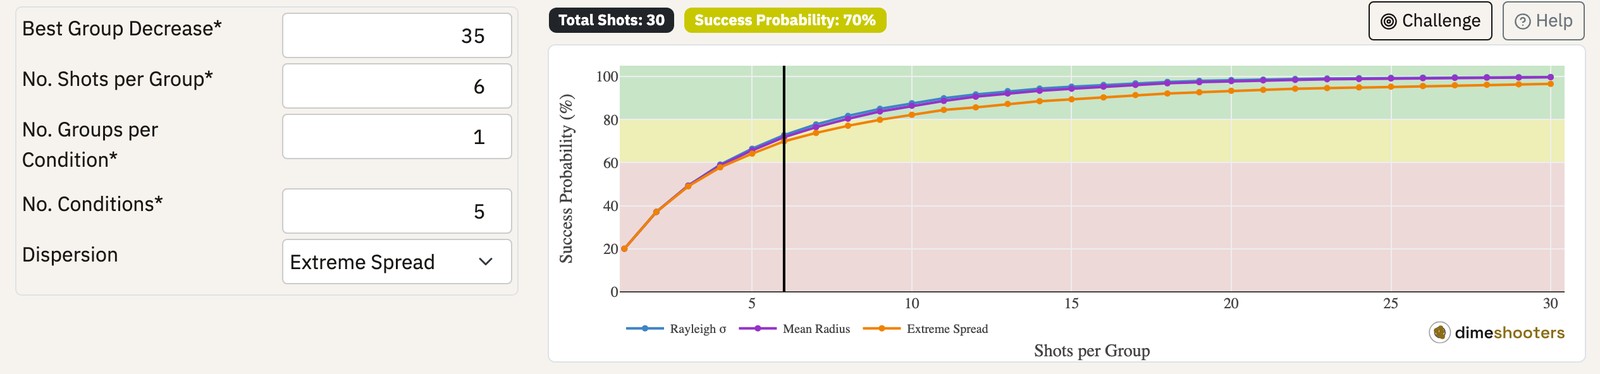
2Print a target built for measurement
Design your own printable targets: aim points, grids, calibers, colors. The corner QR codes tie each sheet to your account, so after shooting you scan any corner with your phone and the photo flattens and analyzes itself.
Your own paper works too. The QR targets just make the process automatic.
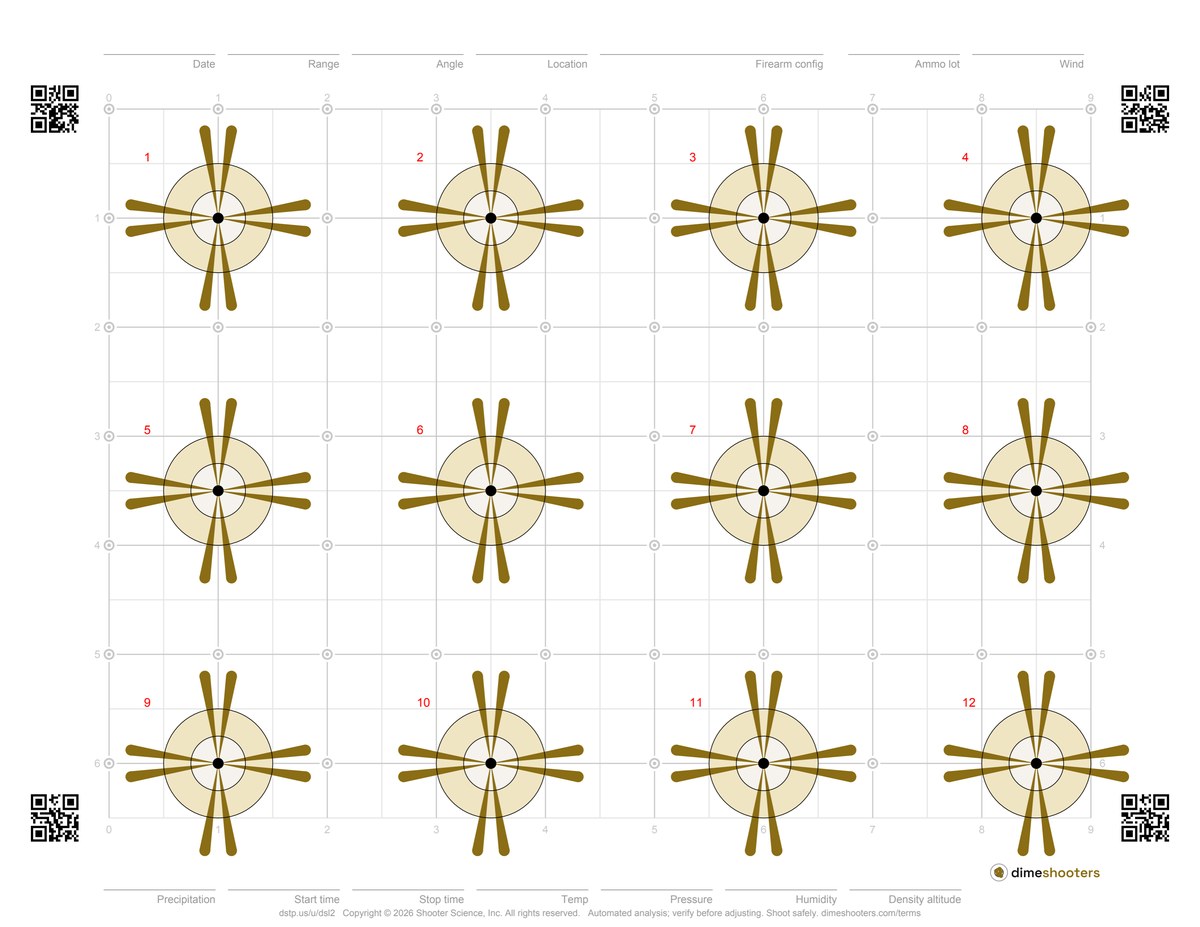
3Shoot it, photograph it, done measuring
One phone photo from any reasonable angle. DimeShooters squares up the image, finds the holes, and takes the measurements. Your targets, groups, loads, and conditions land in a searchable logbook, so “which powder was that again?” always has an answer.
4A pretty good hole detector
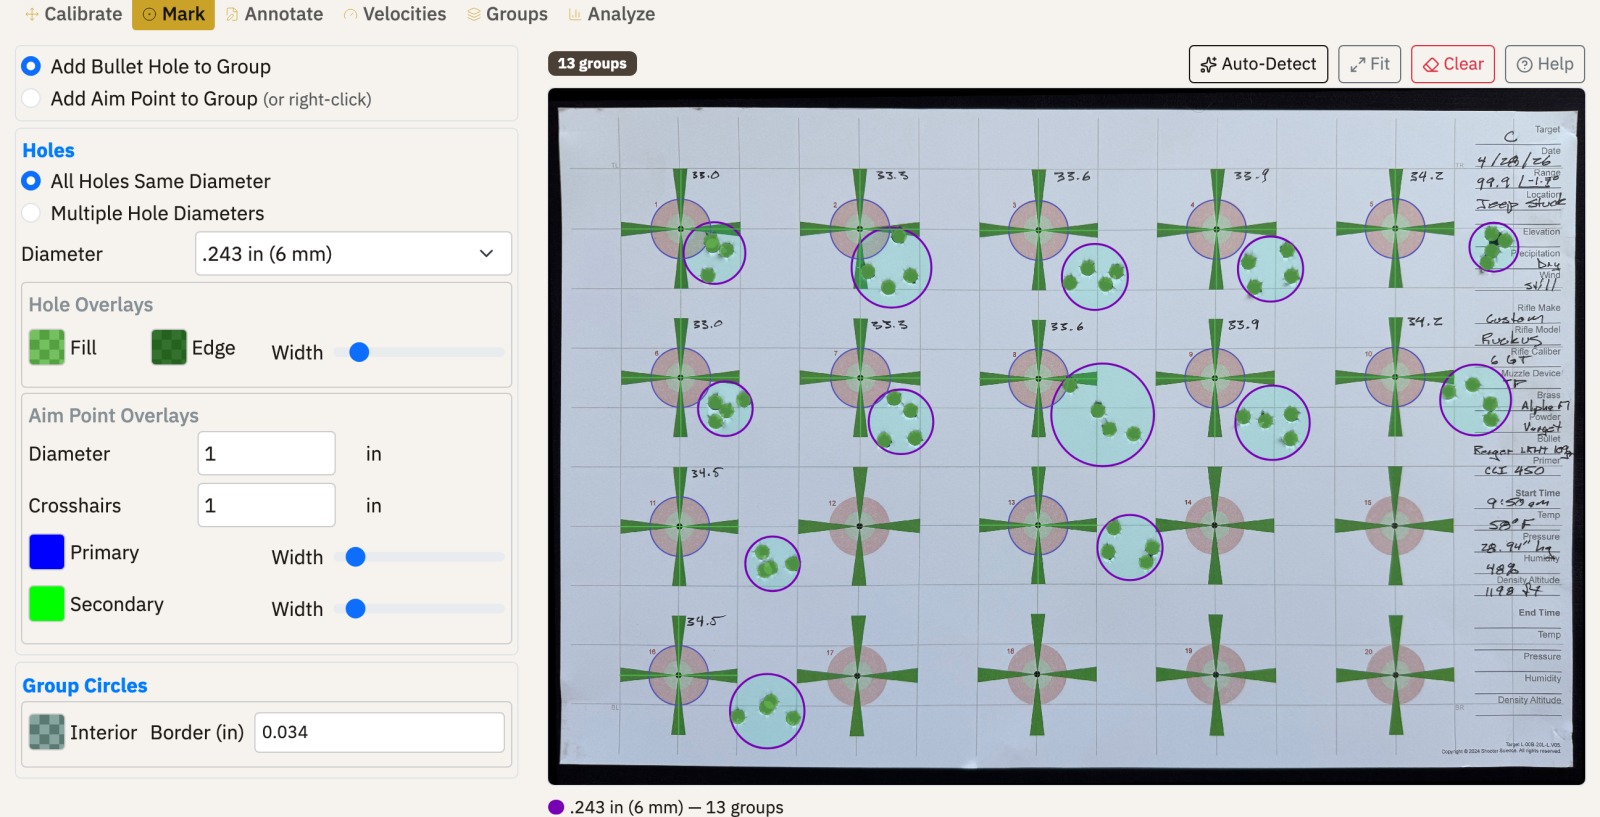
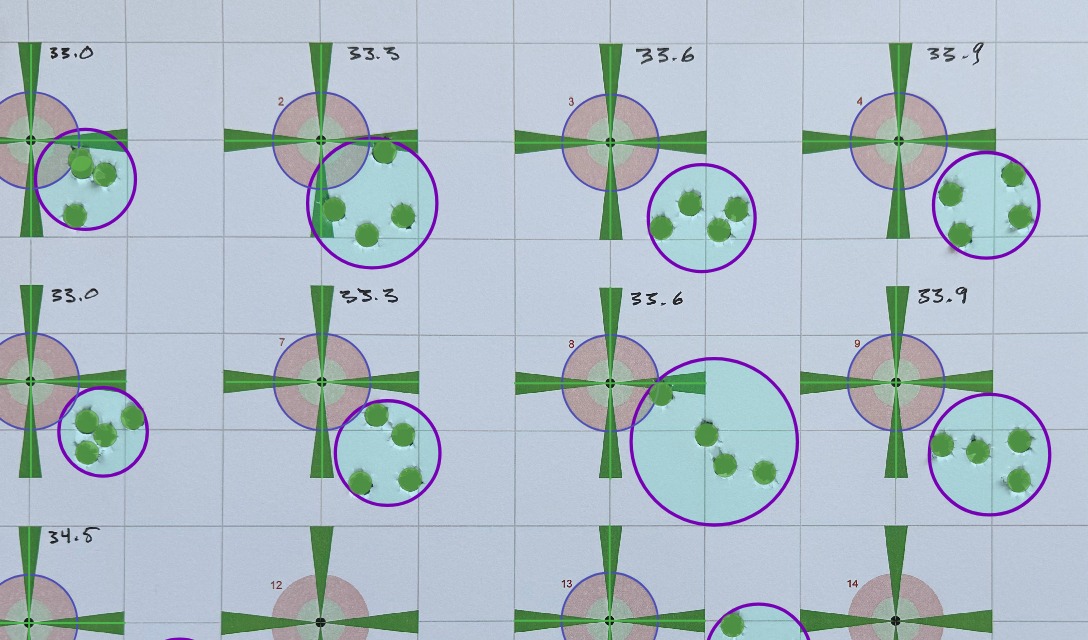
We call our detector pretty good, and we mean both words. Overlapping holes in a tight group are genuinely hard, for algorithms and for humans. So are black holes in the black regions of a target against a black backer. Nobody gets those right every time, including us.
The detector does the first pass so you never measure from scratch: it finds the clear holes in seconds, and you fix the hard ones with a couple of clicks. Every correction you make goes back into training, so the detector keeps improving and will handle a wider variety of targets over time.
5Your speeds, in the same record
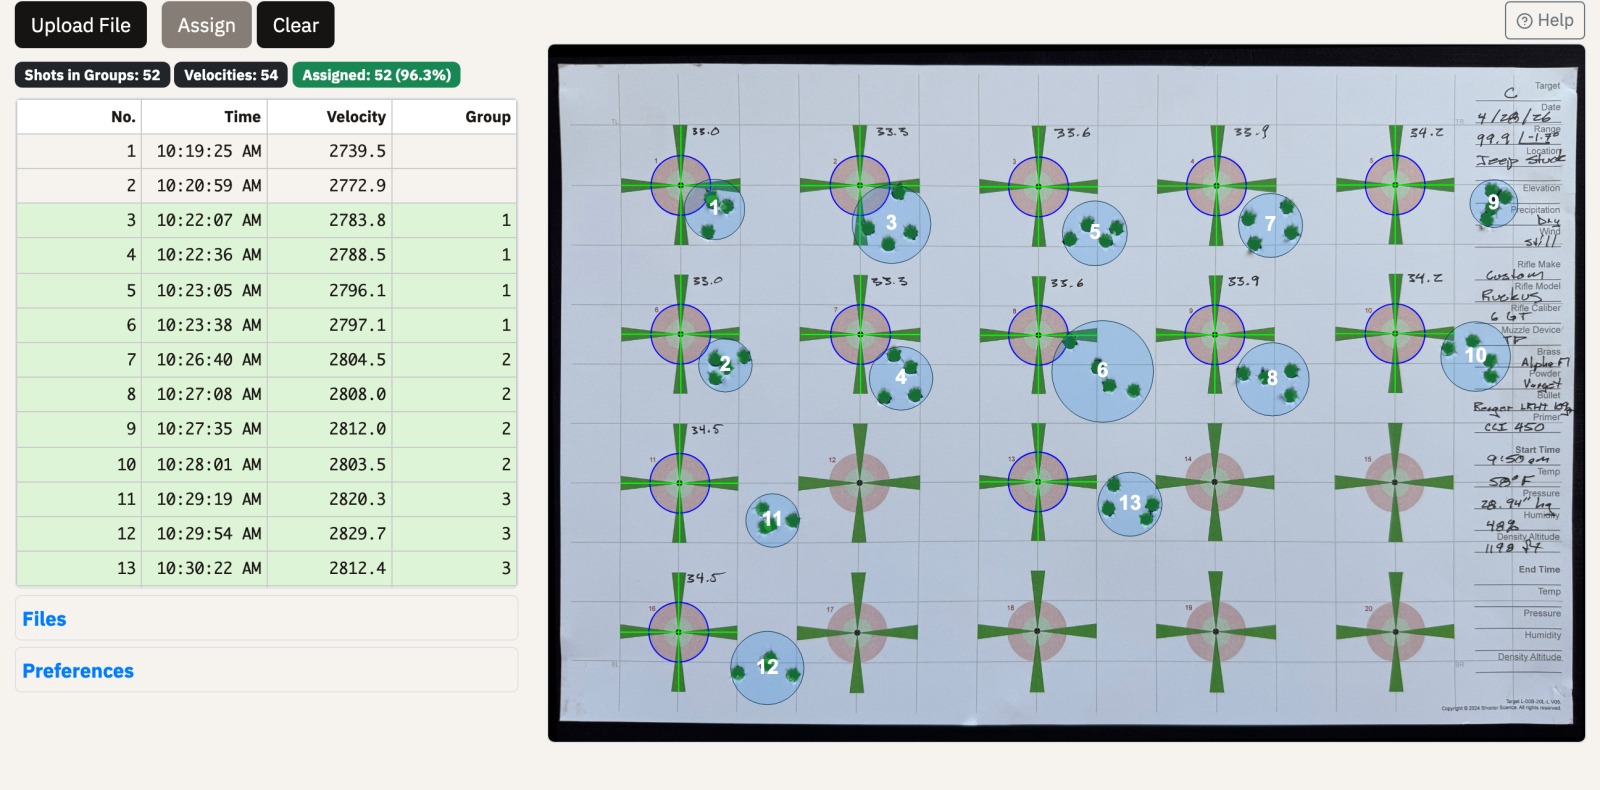
Upload your chronograph file and every shot's velocity is time-stamped and assigned to its group, right beside the holes it made. Velocity average, SD, and extreme spread come along for free.
Straight answer: we import from the Garmin Xero series, whose CSV and XLSX exports load directly. That is the one we support.
6The verdict, in plain language
At the end of a session you get the full picture: every group re-drawn against its charge weight, dispersion with statistical significance shading, zero drift in windage and elevation, velocity against charge with a fitted trend, velocity spread, and shot-order effects.
The statistics answer the question that ruins most load ladders: is the small group actually better, or was it chance? We tell you straight, including when the honest answer is “not enough shots to say.” You saw it above in the demo's Luck check.
The three charts below are live: hover any point, zoom in, and download the picture from the camera button, exactly as you would inside the product. They plot a real 6 GT ladder from our own logbook. Every number is explained in plain language in our Library, so you never have to take a black box on faith.
Every group, re-drawn to scale against its charge weight
Dispersion per charge, and whether the difference is real
Velocity against charge weight
These charts run on frozen data from one of our own sessions, so there is nothing else here to look at. Inside the product they are drawn from your targets.